Part III - Reproducible computing
SSNAP 2018 - Statistical Analysis
Toolkit

Why R?
- Programming language for data analysis
- Free!
- Open source
- Widely used and supported across all disciplines
- Can be used on Windows, Mac OS X, or Linux
- Thousands of statistical data analysis packages

Once in R
You could just type into the command prompt, but that doesn’t help much with
- documentation
or
- automation
A better solution than just R
With RStudio you can combine your programming and your documentation
- Gives you a single environment to combine your documentation and your analysis
- Runs on top of R

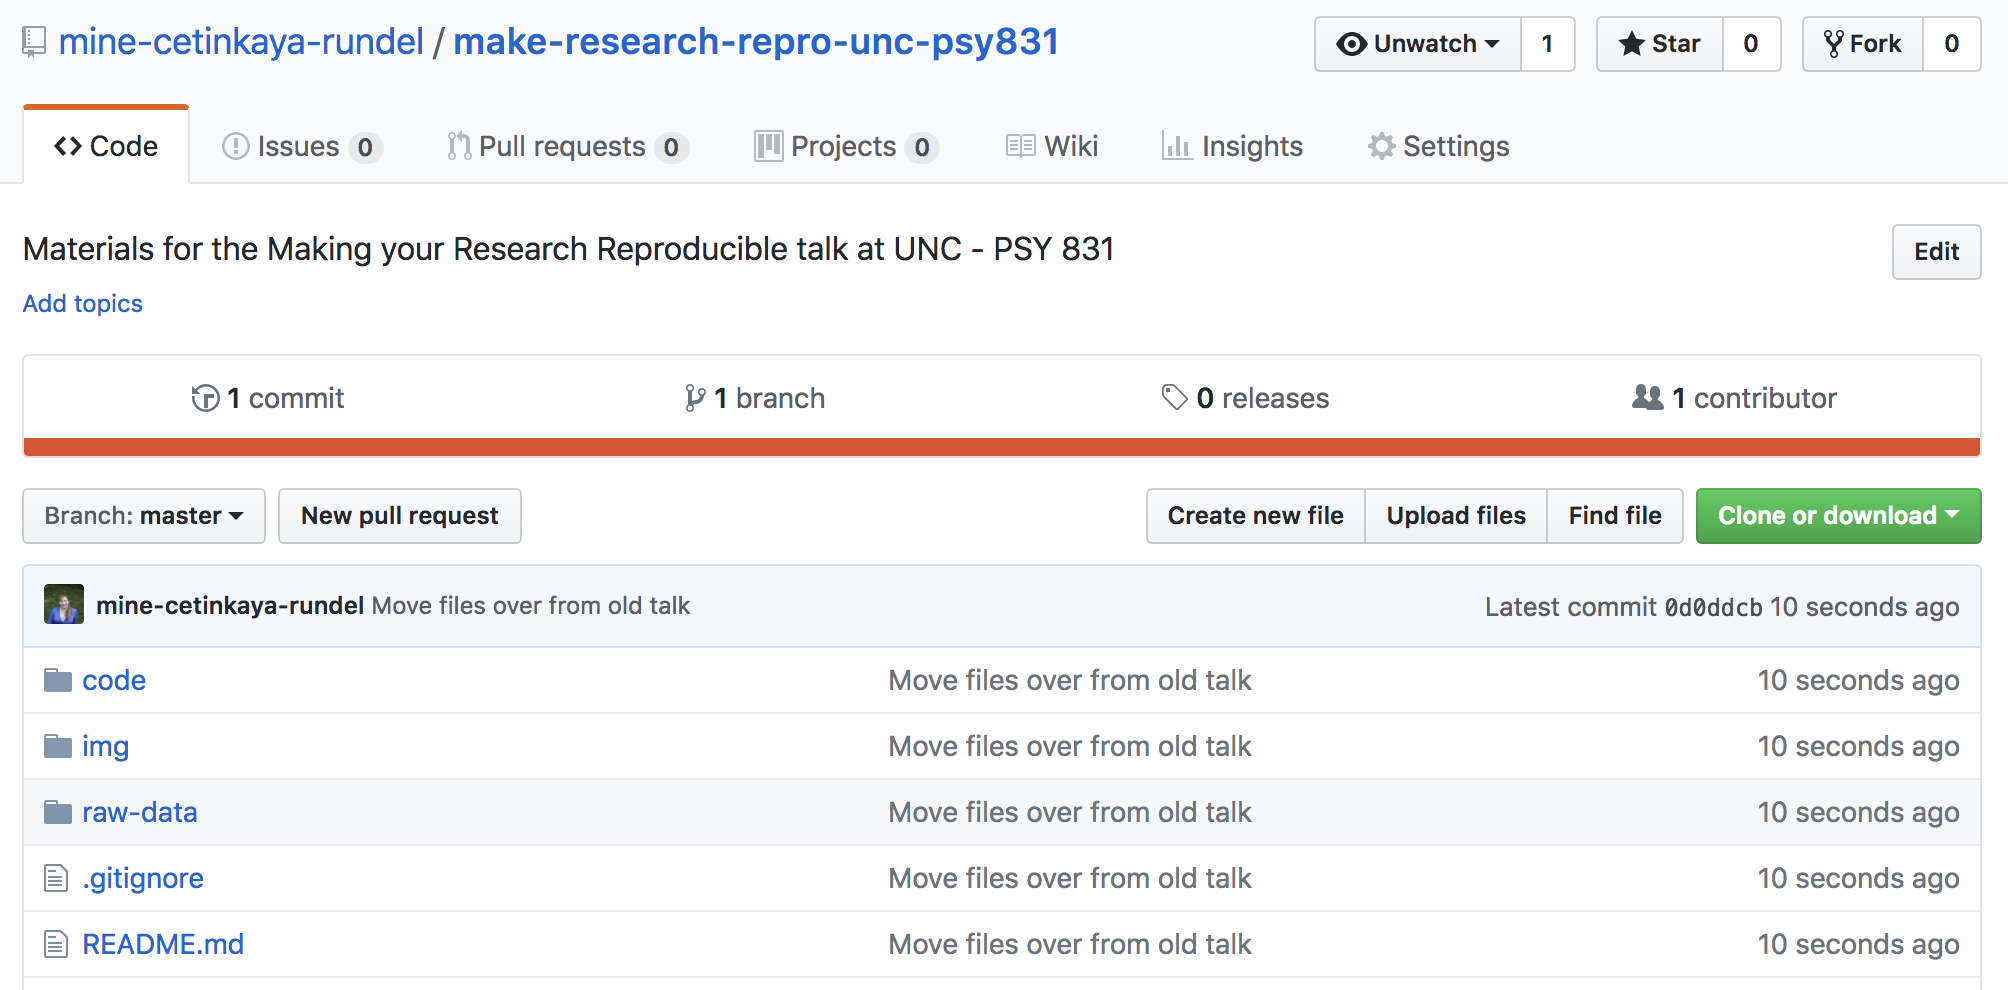
Sample Quarto document

Under the hood

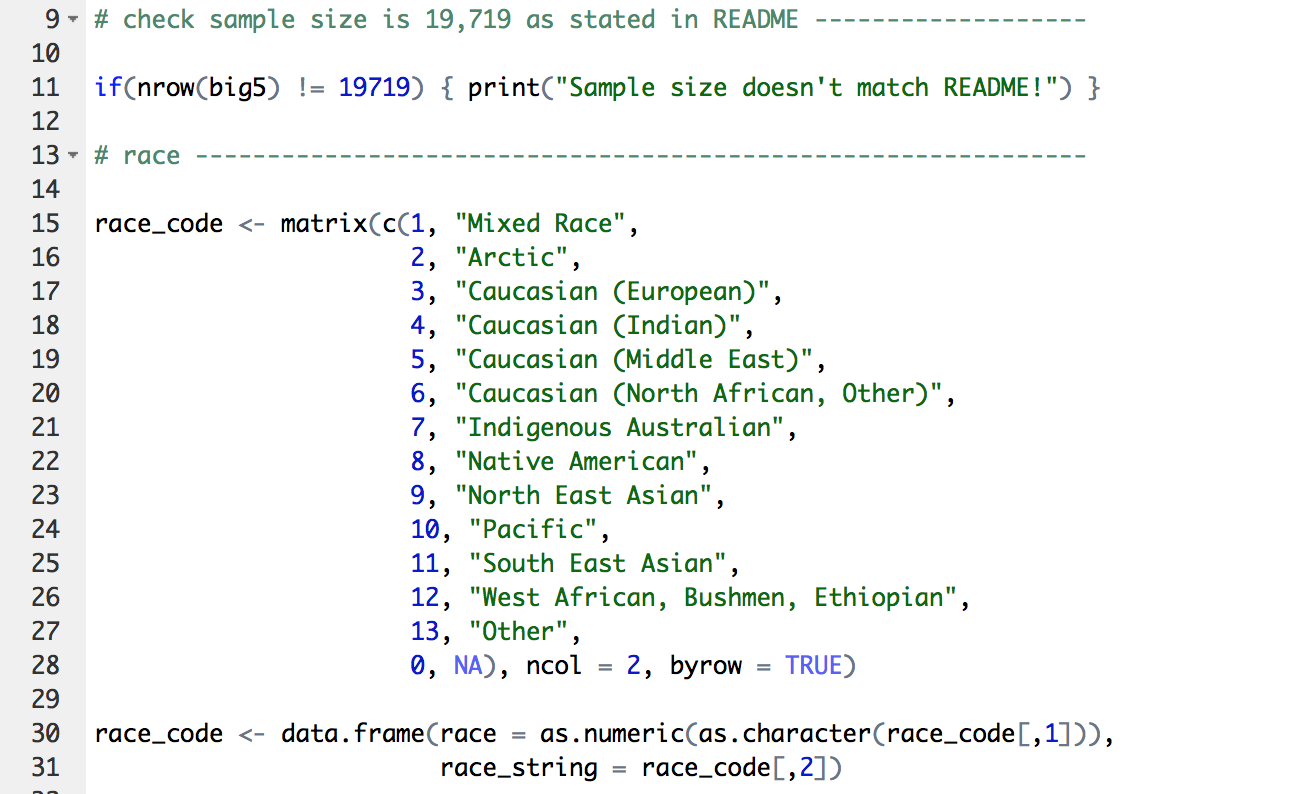
Clean data
You can include script files in your R Markdown document
View distribution of age

Plot extraversion vs. age and gender

Plot for only teens

Bad
Source: Piled Higher and Deeper by Jorge Cham, http://www.phdcomics.com.
Best - Version Control
How does version control work?
Start with a base version of the document, save just the changes you made at each step of the way.
Think of it as a tape: if you rewind the tape and start at the base document, then you can play back each change and end up with your latest version.

- “Playing back” different sets of changes onto the base document and getting different versions of the document.

Commits

Diff

Two-pronged approach
Everyone struggles with reproducibility and it is a hindrance to moving science forward.
#1 Adopt a reproducible research workflow
#2 Train new researchers who don’t have any other workflow
