Incremental list

  • Item 1
  • Item 2
  • Item 3

Penguins

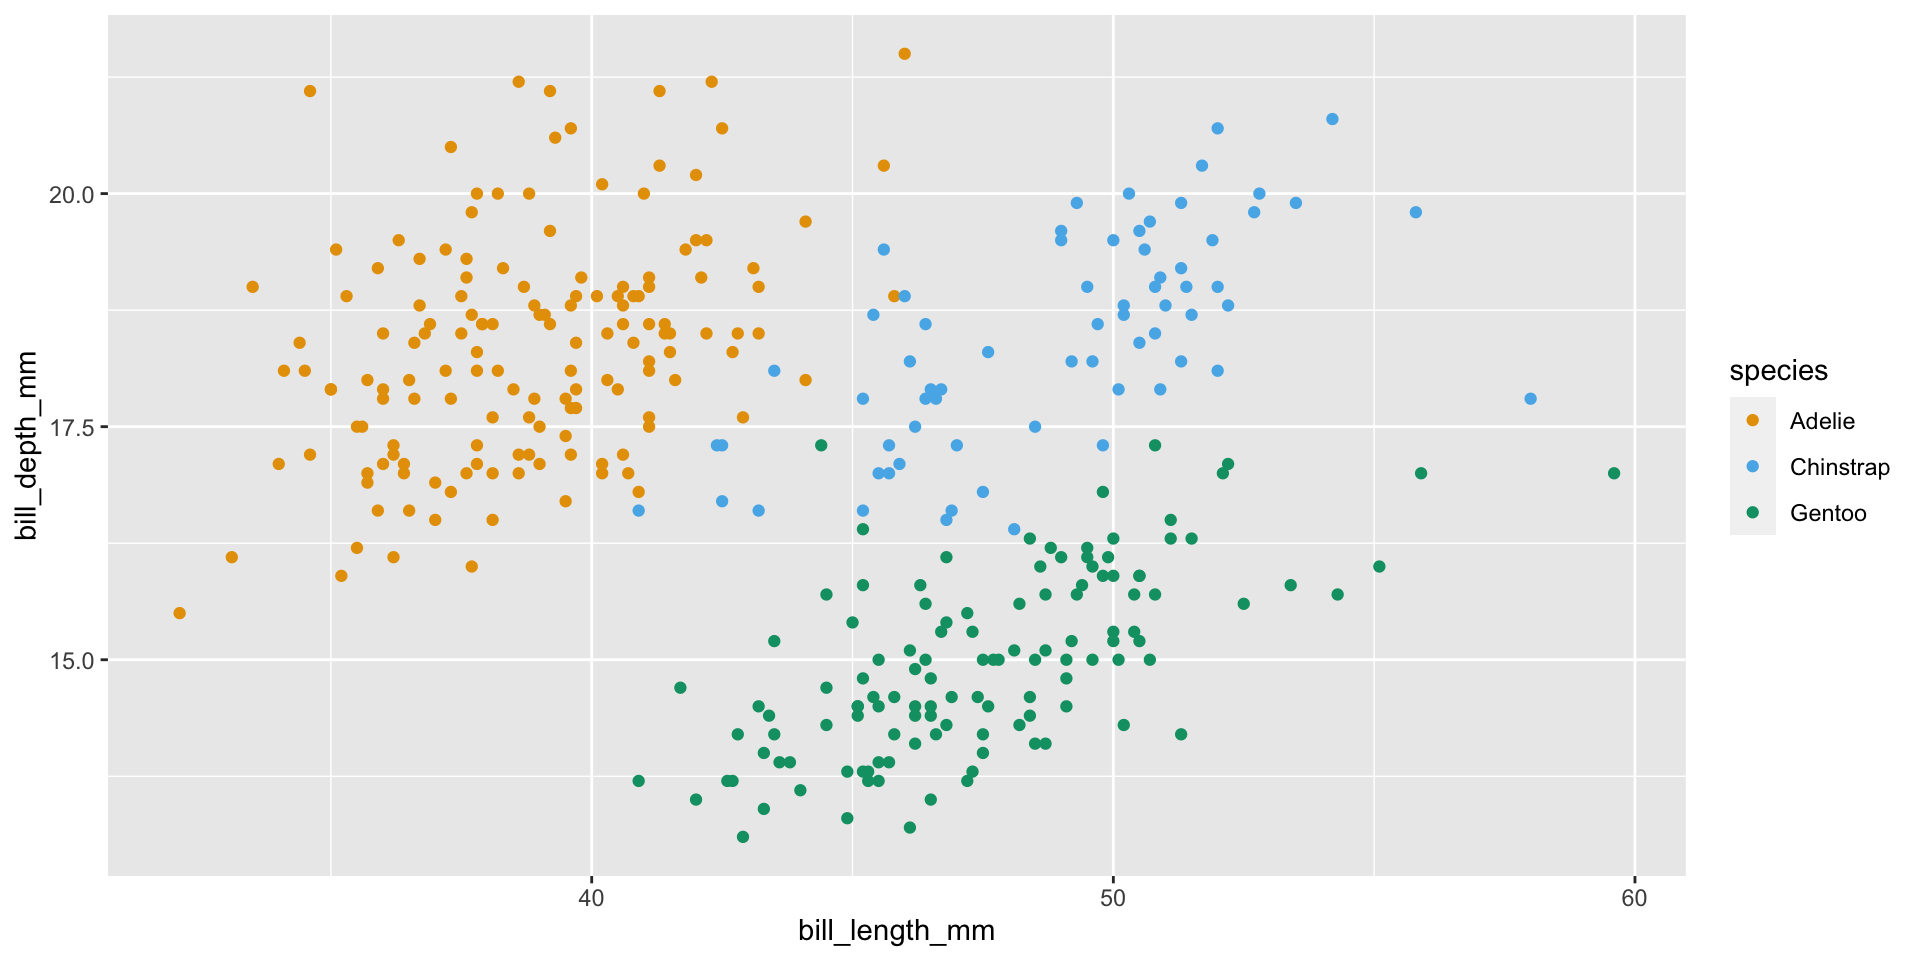
library(tidyverse)
library(palmerpenguins)
library(colorblindr)

ggplot(penguins, 
       aes(x = bill_length_mm, y = bill_depth_mm, color = species)) +
  geom_point() +
  scale_color_OkabeIto()

Scatterplot of penguin bill depth vs. length, colored by species. The relationship is positive for each of the three species.

Moar penguins

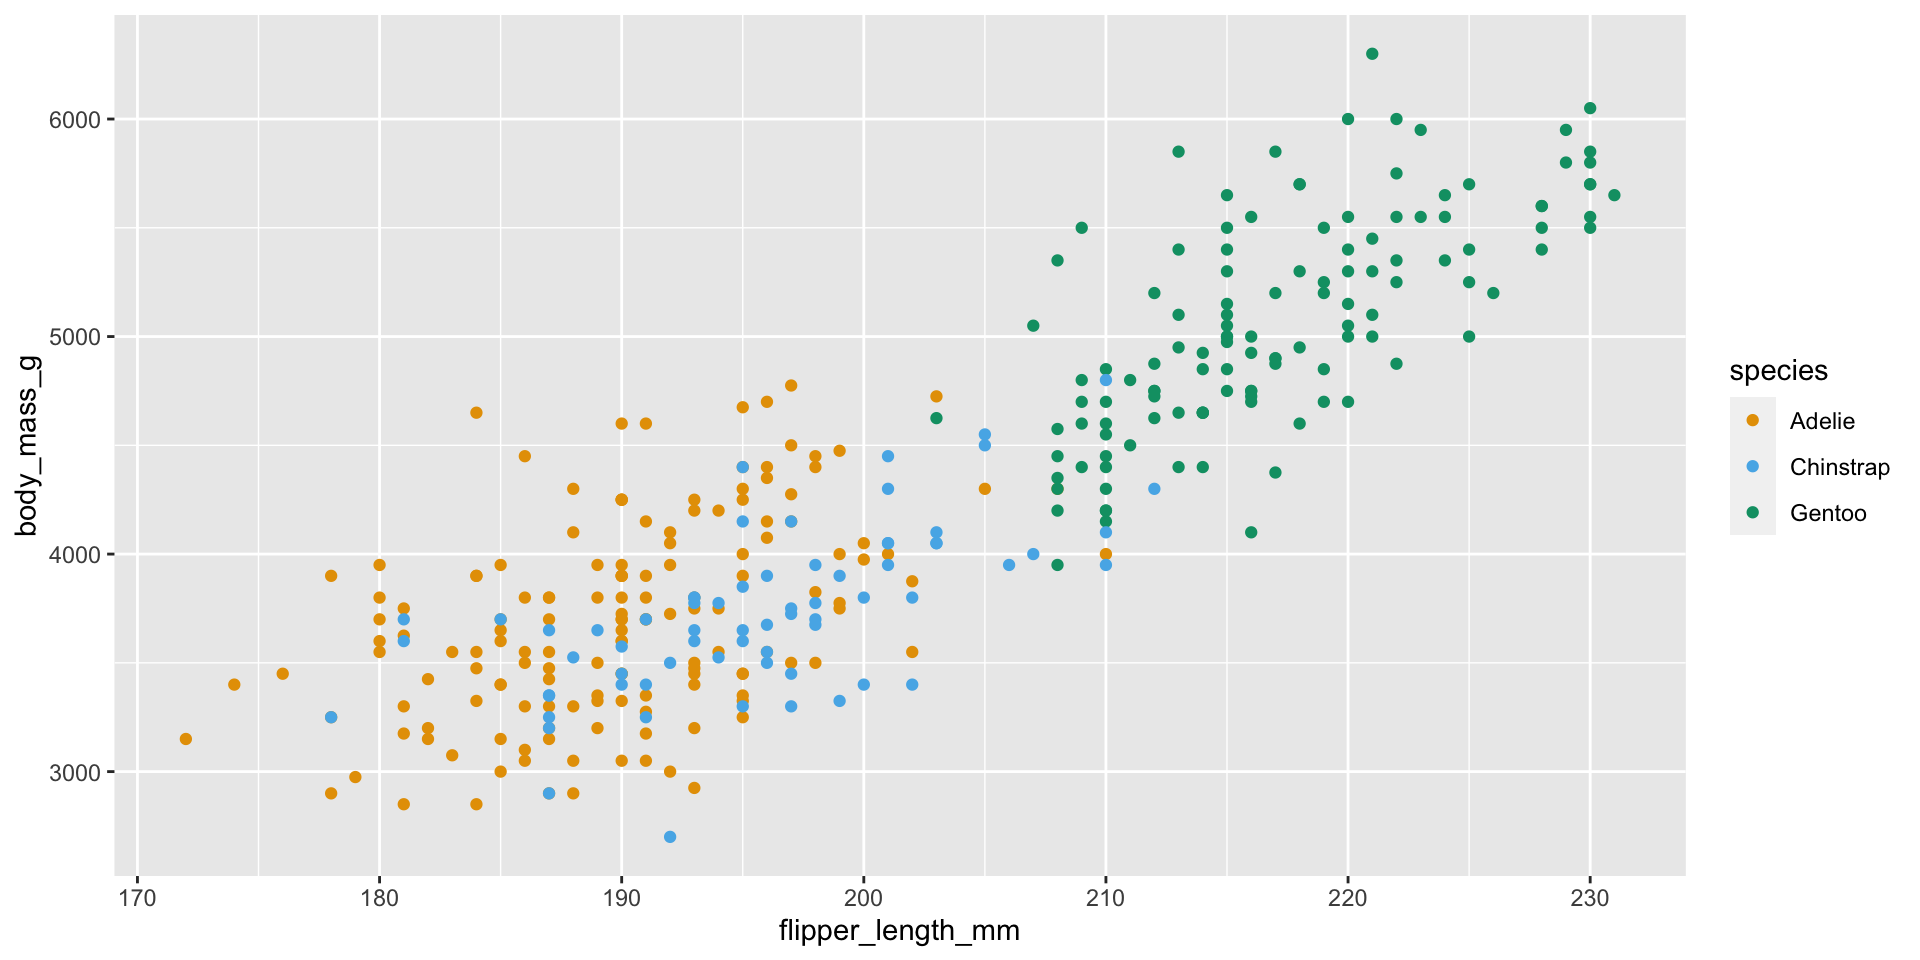
ggplot(penguins, 
       aes(x = flipper_length_mm, y = body_mass_g, color = species)) +
  geom_point() +
  scale_color_OkabeIto()
Scatterplot of penguin body mass vs. flipper length, colored by species. The relationship is positive for each of the three species.