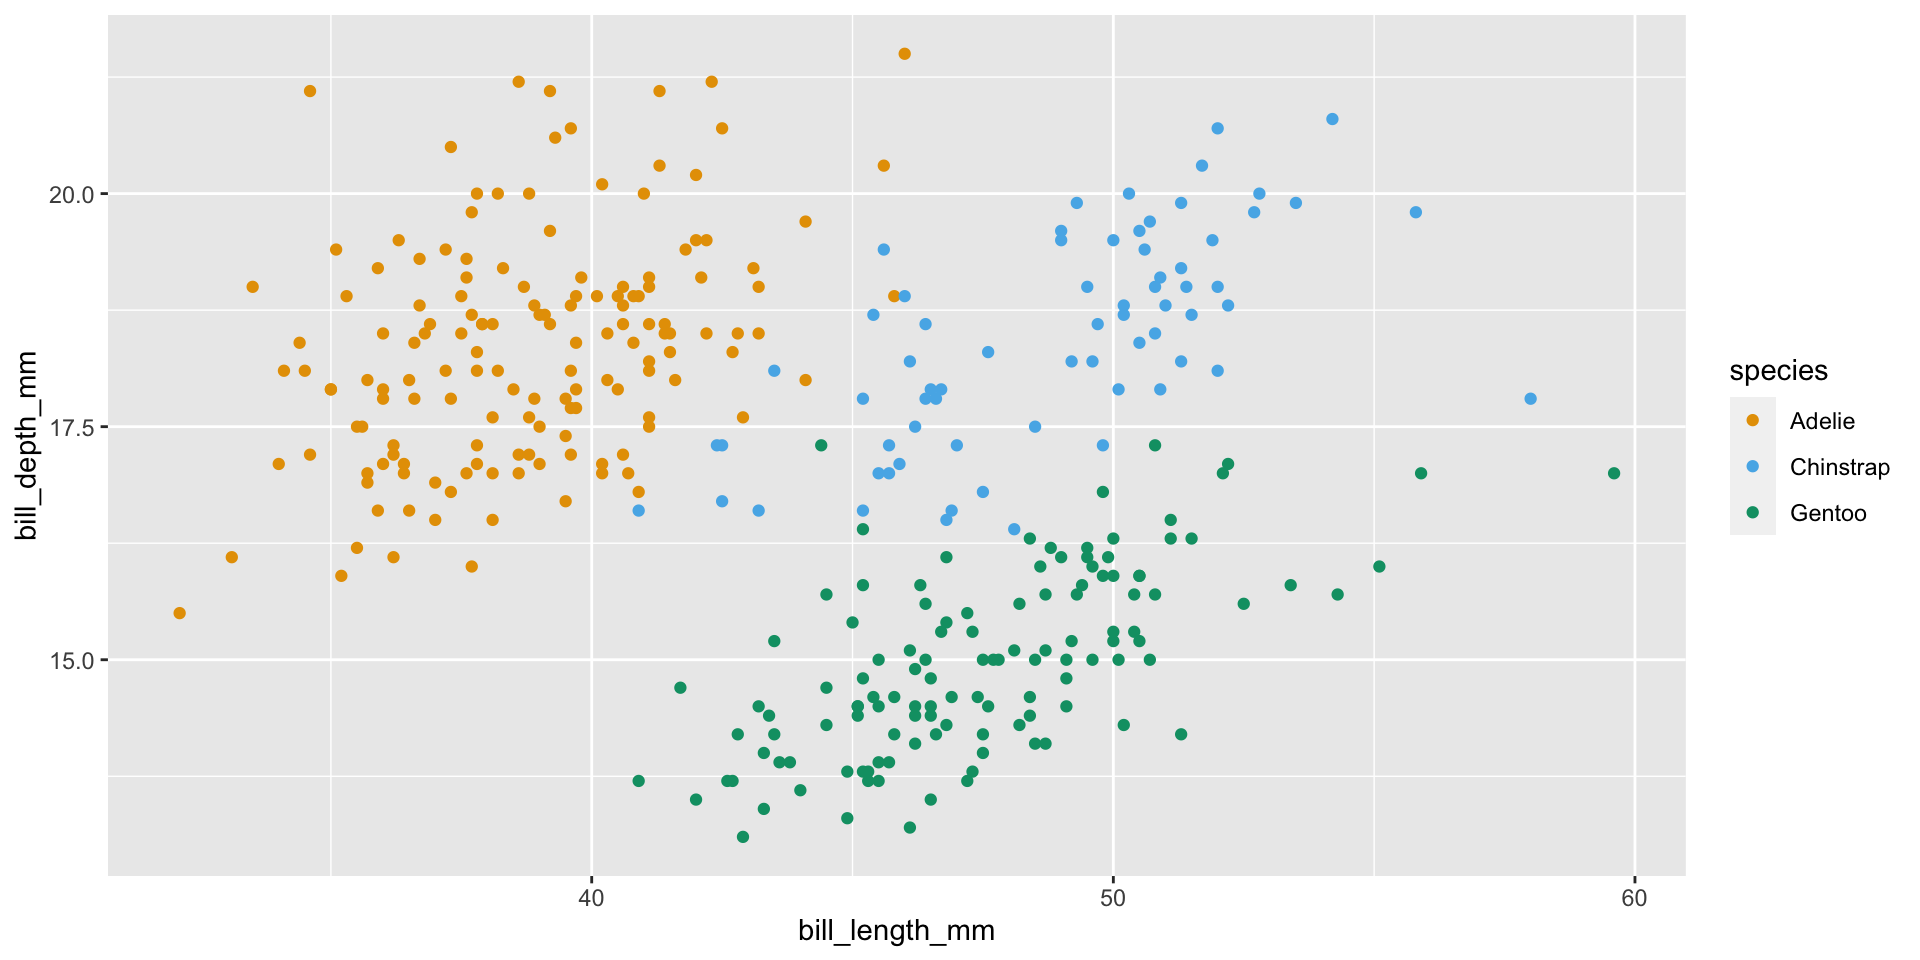
```{r}

ggplot(penguins,
       aes(x = bill_length_mm, y = bill_depth_mm, color = species)) +
  geom_point() +
  scale_color_OkabeIto()
```
output-location: fragment
```{r}
#| output-location: fragment

ggplot(penguins,
       aes(x = bill_length_mm, y = bill_depth_mm, color = species)) +
  geom_point() +
  scale_color_OkabeIto()
```
output-location: slide
```{r}
#| output-location: slide

ggplot(penguins,
       aes(x = bill_length_mm, y = bill_depth_mm, color = species)) +
  geom_point() +
  scale_color_OkabeIto()
```
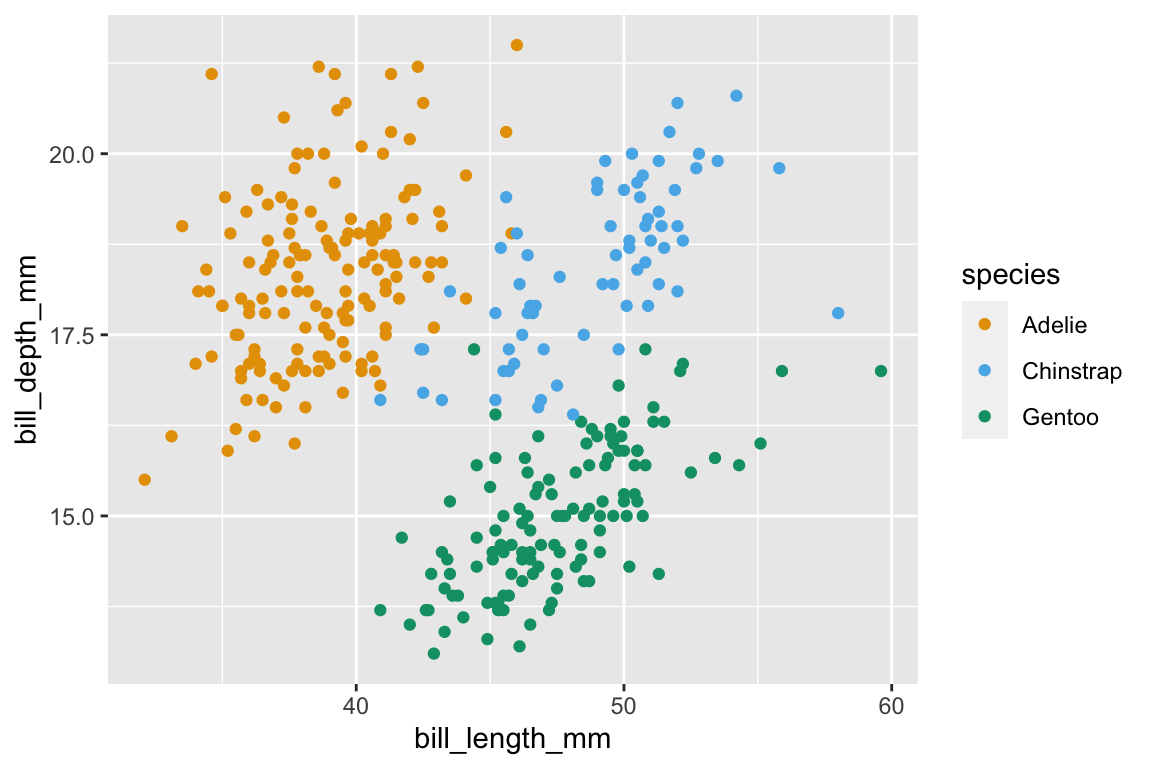
output-location: column
```{r}
#| output-location: column
#| fig-width: 6
#| fig-height: 4

ggplot(penguins,
       aes(x = bill_length_mm,
           y = bill_depth_mm,
           color = species)) +
  geom_point() +
  scale_color_OkabeIto()
```
output-location: column-fragment
```{r}
#| output-location: column-fragment
#| fig-width: 6
#| fig-height: 4

ggplot(penguins,
       aes(x = bill_length_mm,
           y = bill_depth_mm,
           color = species)) +
  geom_point() +
  scale_color_OkabeIto()
```